

Energy is pushing inflation higher again, AI spending is moving from promise to delivery, and the 10-year Treasury yield is pressing against 5%. That backdrop calls for a barbell.
On one side, we want assets with direct exposure to scarcity: energy, copper, precious metals and selected agricultural commodities. On the other, we want the parts of the AI complex that still own pricing power as infrastructure moves into production. Between them, we would keep measured duration rather than make a heroic call on the long end.
The two sides offer different payoff structures. Real assets can benefit from inflation, geopolitical disruption and physical bottlenecks. AI infrastructure can compound through a technology investment cycle. The weak middle is where high financing costs meet undifferentiated growth.
Research has its own barbell. Once the relevant information has been extracted, more inputs can lower decision quality rather than improve it. The edge comes from identifying the variables that move the payoff, then waiting for those variables to change.
Macro: inflation meets a higher real discount rate
August CPI made the tension clear. Headline inflation was 3.4% year over year, core inflation was 2.4%, monthly core CPI accelerated to 0.3%, and the energy index rose 16.3% over twelve months. Energy inflation is no longer a side issue. It is redistributing income from consumers and downstream businesses toward producers and refiners.
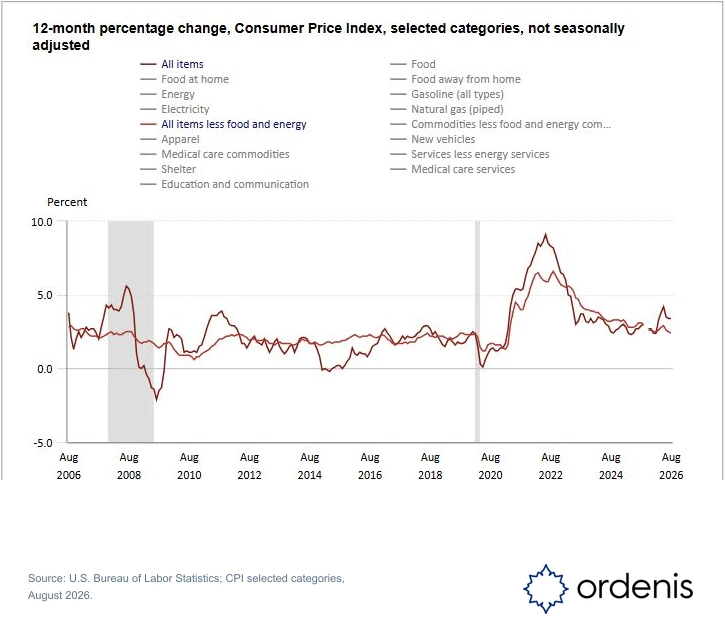
That argues for energy exposure, but not for a broad cyclical bet. Higher fuel costs compete with household spending, while downstream businesses can defend margins only when customers can absorb the price increase. The base case is profit concentration, not economy-wide reflation.
The long end is imposing a second constraint. The 10-year Treasury yield closed at 4.96% on September 11. A day earlier, the 10-year nominal yield was 4.95%, the 10-year real yield was 2.55%, and the implied breakeven rate was roughly 2.40%. The implication is clear: much of the long-end move came through the real discount rate, not an unanchored inflation premium.
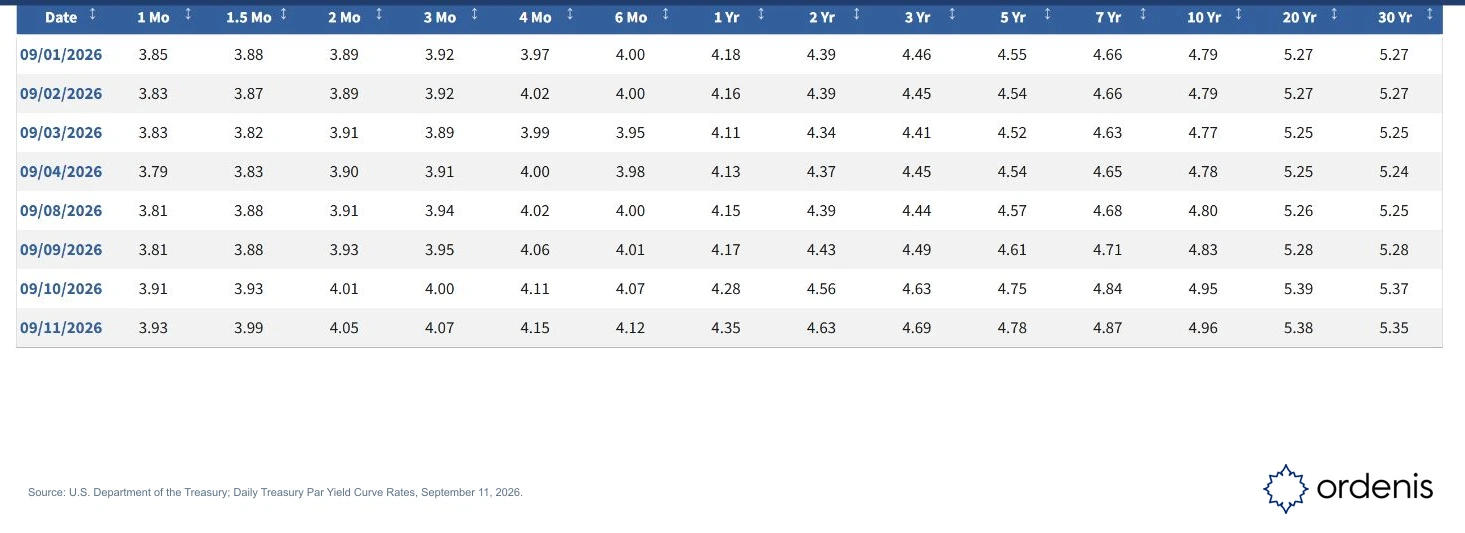
For equities, the distinction is decisive. A higher real rate raises the hurdle for every distant cash flow. Growth assets can still work, but the next leg must come from earnings delivery rather than another round of multiple expansion.
Policy pricing had already absorbed a likely 25-basis-point September move. The more useful question was whether it would be a one-off response or the first step in a new sequence. If energy eased and monthly core inflation returned toward 0.2%, the front end could rally. If core inflation held at 0.3% or higher, the market would have to make room for another move, putting more pressure on long-duration assets.
Fiscal refinancing costs matter for the same reason. As existing debt rolls over, high nominal rates become a larger budget item. Any attempt to compress nominal yields without a credible fiscal adjustment would shift the pressure toward the dollar's purchasing power. That is the channel through which gold belongs in the barbell.
Technology: follow monetization, not labels
We still prefer the hardware side of the AI complex. Equipment entering production creates a visible path from delivery to revenue, and scarce components retain pricing power. The investment question is no longer whether AI demand exists. It is which suppliers keep the economics when the cluster turns on.
That distinction separates differentiated components from assembly. Server integrators can grow revenue quickly while passing most of the value to chip, memory, networking, optical, power and cooling suppliers. A rising top line is not the same as a rising share of the profit pool.
The bottleneck is also moving through the stack. GPUs remain central, but deployment now depends on HBM, interconnect, optical communications, power density and cooling. The best hardware exposure is therefore not a fixed product label. It is the part of the system that still limits delivery.
We would hold the exposure while shipments remain on schedule and supplier margins stay firm. Broad margin compression would be the signal to reduce it. Pricing power, not narrative momentum, is the position's review variable.
Software and cloud services
Software needs a different test: paid usage. The old seat-based model carried high incremental margins. An AI agent can create a new inference cost every time it runs. If the feature is bundled for free, the vendor owns the bill. If usage is metered and customers pay, adoption can translate into gross profit.
That makes renewals, consumption and realized margin more informative than product demonstrations. We would add software exposure when paid conversion becomes visible in reported revenue and gross margin—not when another feature enters a slide deck.
The strongest positions are likely to sit in data management, security and core business systems. These products control records, permissions and operating rules; AI can deepen their role inside the workflow. Peripheral tools with weak switching costs may discover that AI compresses the very revenue they are trying to protect.
Cloud infrastructure requires a longer clock. Platforms spend first, depreciation arrives as capacity comes online, and revenue appears only when customers use that capacity. Prepayments can ease the funding burden, but utilization still determines the return on capital. Capex is part of the thesis, not an accounting footnote.
Energy and refining
We remain constructive on refining into the fourth quarter. The thesis is not an unconditional oil-price call; it is the slow replenishment of finished-product inventories. The September EIA outlook projected a 2027 Brent average of $74 per barrel while U.S. distillate inventories remained below the 2021–2025 range through much of 2027. For refiners with stable feedstock, crude can ease before diesel does, widening the processing margin.
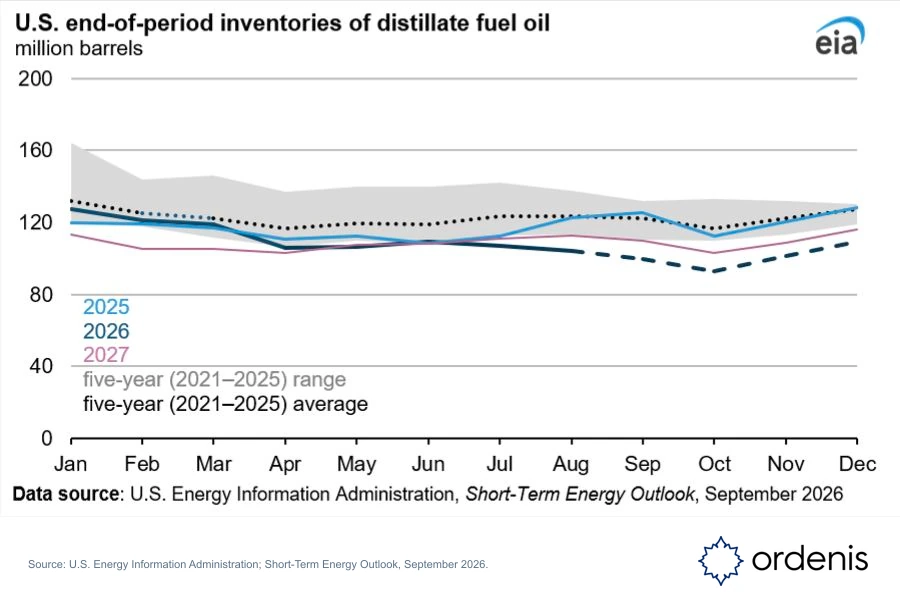
The trade turns on the speed of supply repair. The EIA assumes that flows through the Strait of Hormuz normalize, Middle East exports rise and Asian refiners regain access to feedstock. A prolonged disruption extends high margins; a smooth recovery closes them.
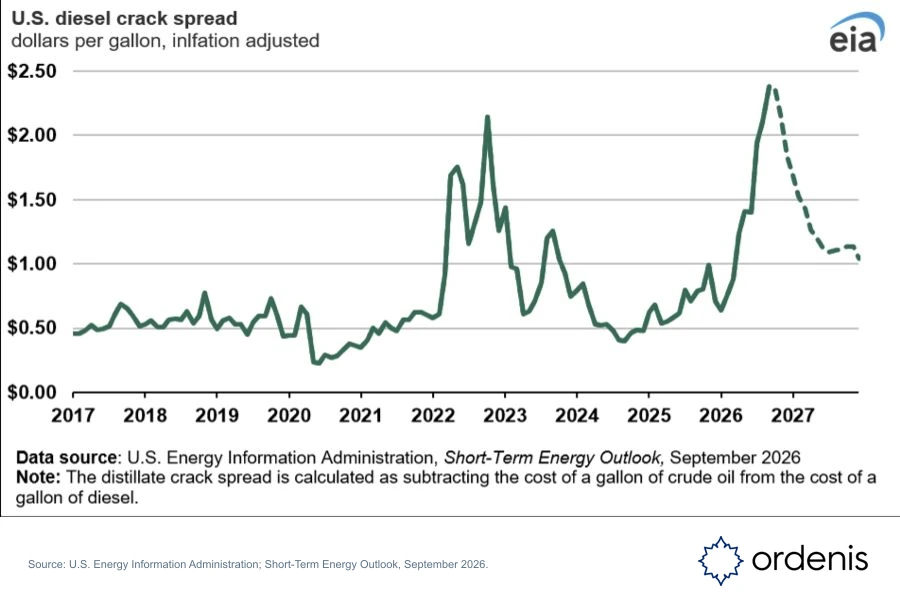
The review rule is simple. If distillate inventories return to the five-year seasonal range while crack spreads narrow, we reduce the position. A lower crude price by itself is not enough to invalidate it.
Gold: a hedge with conditions
Gold remains the monetary side of the barbell. The World Gold Council recorded US$18 billion of global gold ETF inflows in August, the second-largest monthly inflow on record. Holdings rose by 121 tonnes to a record 4,189 tonnes. The move is powerful enough to confirm demand and crowded enough to punish late chasing.
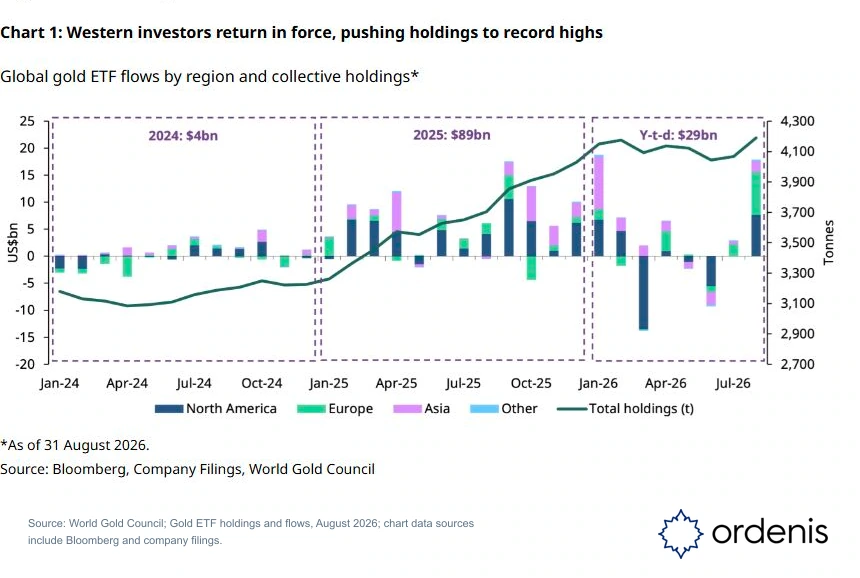
The medium-term case rests on fiscal arithmetic, not one month of flows. High long-end yields increase the refinancing burden and strengthen the incentive to manage nominal rates. Gold gains relevance when investors question the future purchasing power of the unit in which those liabilities are settled.
We would reduce the view if fiscal repair became credible while the dollar and real rates strengthened together. Until then, gold remains a hedge against the policy response to high debt-service costs—not a substitute for monitoring that response.
What changes the view
The barbell is not a permanent allocation. We would change it when:
- energy supply repairs faster than inventories and crack spreads imply;
- core inflation stays firm while real yields continue to rise;
- component scarcity stops translating into supplier margins;
- AI usage grows without paid conversion or durable gross profit; or
- fiscal repair strengthens the dollar and real rates together.
The fourth-quarter trade is to own both sides of a polarized regime, keep the weak middle small, and make every position answer to one observable variable.
Sources
- U.S. Bureau of Labor Statistics, August 2026 CPI release, published September 11, 2026; Figure 1 and inflation observations.
- U.S. Department of the Treasury, Daily Treasury Par Yield Curve Rates, September 2026; Figure 2 and nominal Treasury yields.
- U.S. Department of the Treasury, Daily Treasury Real Yield Curve Rates, September 2026; real-yield observations.
- U.S. Energy Information Administration, September 2026 Short-Term Energy Outlook, released September 9, 2026; Figures 3–4 and the Brent/distillate outlook.
- World Gold Council, Gold ETF Flows: August 2026, published September 9, 2026; Figure 5 and gold-flow observations.